Janet Yellen’s words painted an improving picture for the overall economy. She expressed sufficient improvement in the labor market and gradual increases in economic output. Specifically, the area she cited enthusiastically was the “solid growth in household spending.” For those of us that are interested in knowing what’s happening in our world economically speaking – keeping up with all the different words used by monetarists and economists can become confusing. Personal Consumption Expenditures (PCE) is the i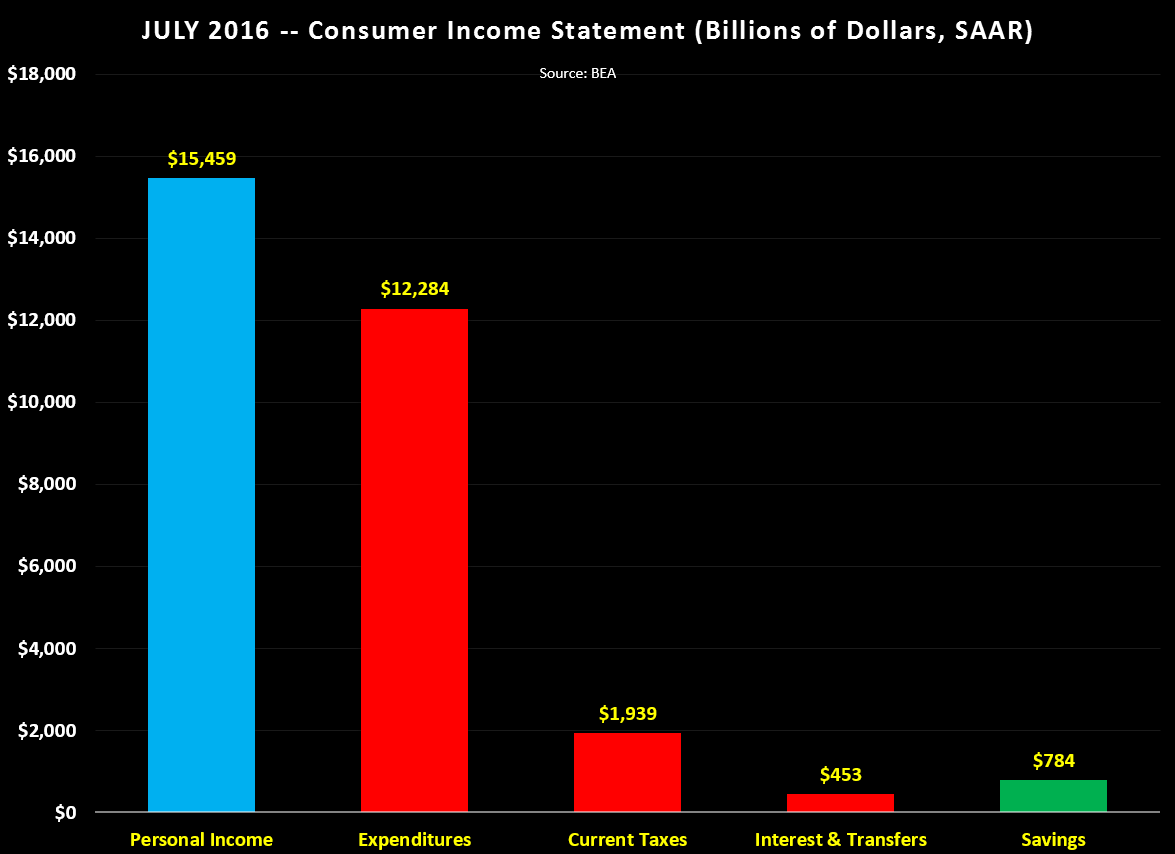 ndicator mostly used by the Federal Reserve. PCE measures overall consumer spending and is broken down by the Bureau of Economic Analysis in two groups: goods and services. On average, the consumers have upped their spending about 3.5 percent a year the past decade. Which group do you suppose consumers increased their spending the most, goods or services? The answer is services. In the United States, two-thirds of economic activity is generated by the consumer. If someone is searching for a worthwhile career or investment, isn’t it logical to focus on the areas offering the best opportunity? Goods purchases have been on a declining scale during this business cycle expansion. In the past 12 months, folks raised their buying of new goods by only 1.3 percent. Spending on services, however, has been a hotspot garnering around 4.4 percent annual increases in consumer spending. Services are here to stay and offer an array of jobs and opportunities ranging from: health care, waste management, recreation and social services, to name a few. In the chart, the columns illustrate the amount of income, expenses and savings consumers are earning, spending and keeping. The blue column shows the amount of income earned; the red columns show the expenses paid, and the green column shows the amount Americans’ are saving annually. Working Americans are socking money away at a rate of 5.7 percent after-tax. That’s a colossal sum of $784 billion dollars, which is more than double the amount saved at the turn of the millennium. Where is all the money going to end up? My guess is that some of the money is going to be reinvested into services.